This article explains how Safous App Gateway checks applications published on its platform. We check for latency, which measures the delay between a user seeking to access the application, and the application's response. To check for latency, we run a sampling process in a continuous loop for applications that the Administrator published via the Admin Portal to the User Portal.
Why Are Health Checks Important
Application health checks expose performance issues that have potential to become a problem for your users. When Safous samples your published applications, we give you an easy-to-understand method of these applications' health and alter you of the need to fix these issues so that users don't experience any lag.
Sampling
An application published on the Safous platform is sampled if:
-
- The application is not a system application (for example, the Recordings or Supervisor consoles that exist in the Safous platform)
- The application is not a wildcard application or network application
- The application is enabled
-
The application is not attached to a cloud provider (for example, AWS)
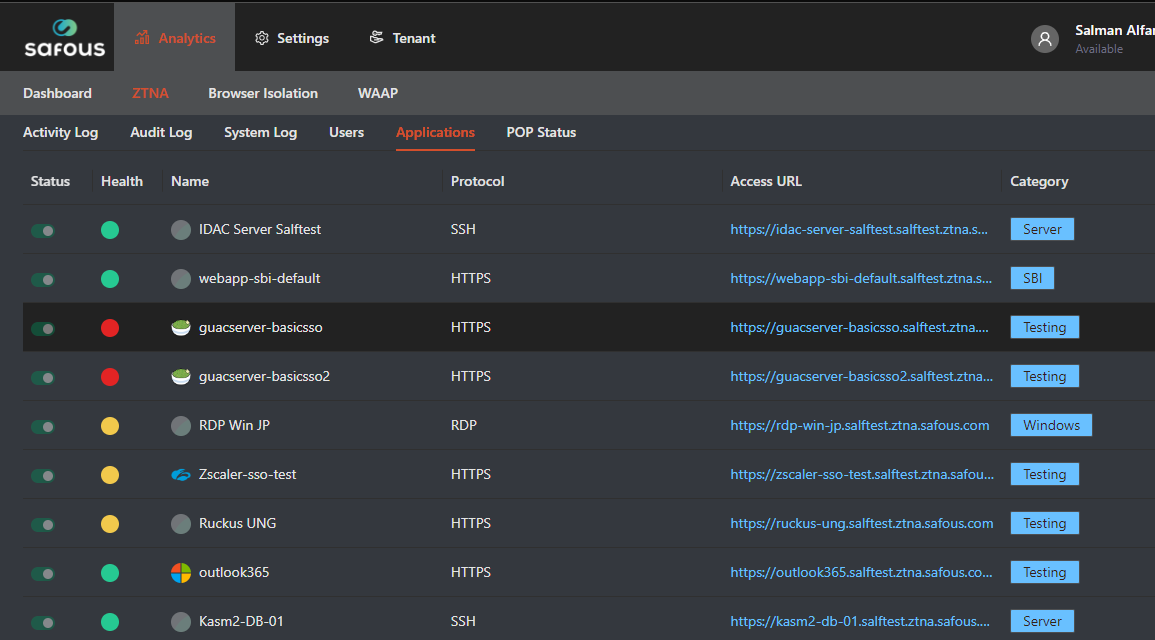
Applications that have high latency are marked with a red dot which demonstrate that that there is a higher response time in accessing the application. High latency applications published in the App Gateway are sampled every 5 minutes. If an application's connection was fixed, the notification takes up to another 5 minutes for another sampling until it return to low latency status.
Healthy applications (with low latency) are sampled every 30 minutes.
For the results to be as accurate as possible, Safous samples each application multiple times and calculates the latency accordingly.
If an application is published on more than 1 App Gateway, the health of that application is calculated based on the average of all App Gateway samples. For instance, if there are 3 App Gateways that all publish the www.CNN.com website as an application, the health response for that application is the average of all the IDAC samples.
What Do Our Latency Tiers Mean
It is important to remember that low latency is a 'good thing.' It means that there is little lag time between the user's request to access the application and the time it takes them to be served with the application.
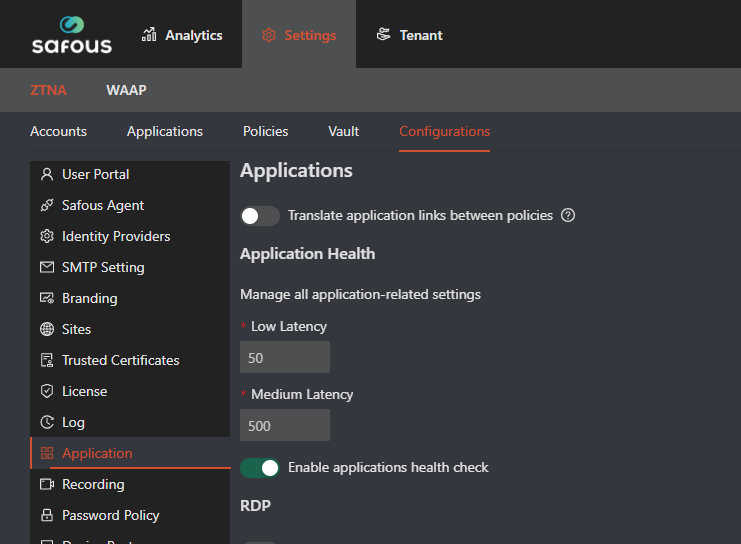
- Low_latency (Green dot): Between 0 to the “low_latency” attribute, 50 milliseconds
- Medium_latency (Orange dot): Between “low_latency” to the “medium_latency” attributes, 500 milliseconds
- High_latency (Red dot): Between the “medium_latency” attribute to our default timeout, with timeout = 15 seconds. You cannot change the timeout duration. A red dot can also mean that the application is unavailable. In all circumstances, applications with a red dot are not available to users.
- Unsampled (no dot): The application was not yet sampled.
The health of the application can be checked under Analytics > ZTNA > Applications
Logs
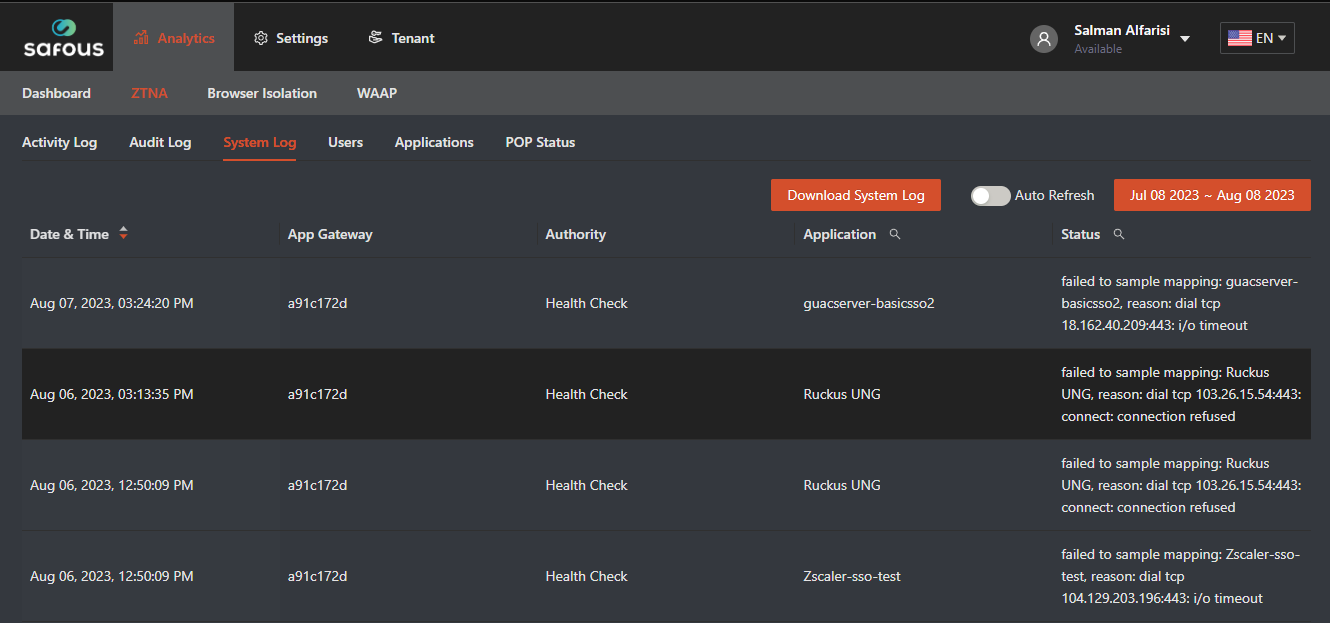
If Safous fails to sample an application, it logs this failure into the Admin Portal's Log screen, under Analytics > ZTNA > System Logs. These error messages will include:
-
The specific IDAC that failed to sample
-
The specific applications that could not be sampled
-
The errors that Safous encountered (e.g., timeout, connection refused)
Below is a sample screenshot of the Log screen when applications are sampled:
Enabling or Disabling Health Checks
Applications health checks are enabled by default in the Admin Portal under Settings > ZTNA > Configuration > Applications.